
3.2.P.5.4–5.6 Batch Analyses, Drug Product Impurities, and Justification of Specification: Closing the Evidence Loop
Sections 3.2.P.5.4, 5.5, and 5.6 are where the drug product specification is tested against reality. The batch analysis data must demonstrate that the process reliably meets the specification; the impurity…
On this pageArticle overview
Sections 3.2.P.5.4, 5.5, and 5.6 are where the drug product specification is tested against reality. The batch analysis data must demonstrate that the process reliably meets the specification; the impurity discussion must account for all degradation products at or above the reporting threshold; and the specification justification must explain why each limit is where it is — scientifically, not just conventionally.
The framing that FDA reviewers bring to P.5.4 through P.5.6 is distinct from the framing they bring to P.5.1 through P.5.3. In the first half of the section, the reviewer is evaluating whether the specification and its supporting methods are correctly designed. In the second half, the reviewer is evaluating whether the specification design is validated by evidence: does the batch history show that the process performs within the specified limits consistently and with appropriate margin, does the impurity profile account for every degradation product at or above the ICH Q3B(R2) reporting threshold, and does the specification justification translate observed batch performance and safety data into defensible acceptance criteria? Sections P.5.4 through P.5.6 function as the evidentiary close of the drug product testing package — reviewers specifically look at these sections to identify specifications set too loosely relative to observed batch data, degradation products not addressed in the specification, and limits asserted without scientific basis.
What Batch Analysis Data Must Demonstrate in 3.2.P.5.4: The Specification-vs-Performance Story
The batch analysis section under 3.2.P.5.4 is structurally straightforward and substantively demanding. The requirement, as defined in the ICH CTD format and reflected in 21 CFR 314.50(d)(1)(ii), is that the applicant provide results of batch analyses for the drug product, with data presented in a format that links each result to its acceptance criterion. In practice, this means a tabular presentation for each batch tested, identifying the batch number, batch size, manufacturing date, manufacturing site, dosage form and strength, and the test results for every attribute in the specification — assay, degradation products by individual identity and total, uniformity, dissolution, appearance, water content, and all other specified attributes. The table is not a summary; it is a complete record. FDA reviewers have issued deficiency letters in cycles where applicants submitted batch analysis summaries — mean values across a batch set, for example, without individual batch data — because a mean value that meets the specification provides no information about the range of values within the batch population, and it is the range that demonstrates process consistency.
The minimum number of batches required to constitute an adequate P.5.4 data set is defined by the product’s development and registration history, not by a universal numerical rule. For an NDA or BLA submission under 21 CFR Part 314, the expectation is that the batch analysis data encompass batches used in pivotal clinical studies — the batches that establish the clinical bridge — plus the process performance qualification (PPQ) batches from the commercial manufacturing site. The PPQ batches are the most consequential data in P.5.4 because they are the batches produced under the validated commercial process, and it is their analytical results that confirm the specification is achievable under routine manufacturing conditions. Where pivotal clinical batches were manufactured at a scale or site different from the commercial process, the comparability between those batches and the PPQ batches must be documentable from the batch analysis data — if the clinical batches showed a degradation product at 0.08% and the PPQ batches show the same degradant at 0.15%, that trend has direct relevance to both P.5.5 and P.5.6 and will draw reviewer attention.
The analytical dimension of P.5.4 that generates the most deficiencies is the trending analysis. Individual batch results that all pass the specification do not by themselves demonstrate process control. A reviewer examining six PPQ batches in which the total degradation product result trends from 0.12% to 0.19% to 0.27% to 0.35% to 0.42% to 0.48% — all results below a 0.50% specification limit — will not conclude that the process is under control. The reviewer will ask how many more batches can be produced before the specification is breached, why the degradant is increasing, and whether the specification limit of 0.50% was set to accommodate a known process drift rather than to reflect a safety-justified threshold. The XGene Batch Data-to-Specification Alignment Review addresses this directly through its Trending Analysis check: multi-batch directional movement toward a specification limit constitutes a process capability signal that must be investigated, documented, and resolved before submission. An upward trending impurity result in PPQ batch data that is presented without investigation or comment is one of the clearest indicators to a reviewer that the P.5 package was assembled rather than analyzed.
Process capability quantification is the second analytical dimension of P.5.4 data. The Cpk index — defined as the minimum of (USL − mean) / (3σ) and (mean − LSL) / (3σ), where USL and LSL are the upper and lower specification limits and σ is the standard deviation of the batch results — translates the batch dataset into a dimensionless index of how much margin separates typical process output from the specification boundary. A Cpk of 1.33 corresponds to the boundary at four standard deviations from the process mean, which is the conventional threshold for a process considered capable with adequate guard band. A Cpk below 1.33 means the process is producing results close enough to the specification limit that a modest perturbation could produce an out-of-specification result. The XGene framework flags Cpk below 1.33 as requiring specification tightening or process improvement documentation. The framework equally flags Cpk above 3.0 as a signal that the specification may be set far wider than the process requires — which raises the question of whether the specification would detect a clinically meaningful deterioration in product quality.
Out-of-specification results in the batch analysis dataset require explicit documentation in P.5.4. The FDA’s 2006 Guidance for Industry on Investigating Out-of-Specification (OOS) Test Results for Pharmaceutical Production defines the two-phase investigation protocol: the laboratory phase, which determines whether the OOS result is attributable to a laboratory error, and the full-scale investigation, which determines whether the result reflects a genuine product quality failure. If an OOS investigation concluded that the result was due to a confirmed laboratory error, the investigation summary and the final disposition of the batch must appear in the batch analysis data presentation. If the investigation concluded that the result was a genuine product quality failure and the batch was rejected, that batch should be identified with its disposition outcome. Presenting only passing batch data without disclosing that additional batches were manufactured and tested — and why those results are absent — is an omission that FDA reviewers treat as a submission integrity concern.
The Impurity Profile Section and the ICH Q3B Qualification Standard for Drug Product Degradants
Section 3.2.P.5.5 requires a discussion of the drug product impurity profile, and the regulatory standard against which that discussion is evaluated is ICH Q3B(R2), the 2006 guideline for impurities in new drug products. ICH Q3B(R2) establishes a tiered threshold system that governs how degradation products must be handled as a function of their observed level. The thresholds vary by maximum daily dose (TDI) of the drug product:
Reporting Threshold: 0.10% for TDI ≤ 1 g; 0.05% for TDI > 1 g
Identification Threshold: 0.10% or 1.0 mg TDI (whichever is lower) for TDI ≤ 1 g; 0.05% for TDI > 1 g
Qualification Threshold: 0.15% or 1.0 mg TDI (whichever is lower) for TDI ≤ 1 g; 0.05% for TDI > 1 g
At or above the reporting threshold, any degradation product must be reported in the batch analysis and discussed in the impurity profile. At or above the identification threshold, the degradant must be structurally characterized. At or above the qualification threshold, the degradant must be qualified through toxicological assessment, which may include in silico mutagenicity assessment under ICH M7(R1), literature review, or dedicated toxicology studies.
The practical consequence of ICH Q3B(R2) for P.5.5 is that the degradation product discussion must be organized by compound identity — not merely by chromatographic peak number — for any peak observed at or above the identification threshold in the batch analysis dataset, the forced degradation studies, or the stability data from Section P.8. The origin of each identified degradant must be characterized: is it an oxidation product, a hydrolysis product, a photodegradation product, or a product of excipient-API interaction? The mechanism of formation is relevant because it governs how the degradant behaves across the shelf life: an oxidation product formed rapidly under accelerated storage conditions will accumulate at a different rate under real-time conditions than one formed by slow hydrolysis. The fate of each degradant through shelf life must be traceable from the P.8 stability data — the impurity level at release, at the intermediate stability time point, and at the proposed shelf life — because the specification limit for that degradant in P.5.1 must be set at a level above the highest observed value at shelf life while remaining below the qualification threshold unless a qualification package supports a higher limit.
The intersection of ICH Q3B(R2) and ICH M7(R1) is a dimension of P.5.5 that has grown in regulatory prominence. For any structurally characterized degradation product that contains an alerting structure for mutagenic activity — a structural feature associated with the potential to cause DNA damage — ICH M7(R1) requires that the degradant be assessed for mutagenic potential and, if the compound cannot be excluded from concern on structural grounds, that the acceptable intake limit derived under the threshold of toxicological concern (TTC) principle be compared against the patient’s actual exposure. Where the observed degradant level in batches at shelf life would result in patient exposure above the M7(R1) acceptable intake limit, a qualification study — typically an in vitro Ames test and a confirmatory in vivo genotoxicity study — is required, and the specification limit must be set at a level that ensures patient exposure remains within the qualified limit. The P.5.5 discussion must reflect this logic explicitly. A deficiency letter requesting “structural characterization and M7(R1) assessment for degradant X, observed at 0.12% in batch [number] — above the identification threshold for this product’s daily dose” is a direct consequence of omitting this analysis when the data clearly supports the obligation.
Specification Justification in 3.2.P.5.6: Using Batch Data to Close the Acceptance Criterion Argument
The specification justification section under 3.2.P.5.6 is, in the logic of the P.5 package, the closing argument. The specification was proposed in P.5.1, the methods were validated in P.5.3, the batch data was presented in P.5.4, and the impurity profile was discussed in P.5.5. Section P.5.6 must now explain, for each acceptance criterion in the specification, why that limit is set where it is. ICH Q6A’s guidance at section 3.2.P.5.6 is explicit that acceptance criteria should be set based on the data obtained during development, safety and efficacy data obtained during clinical trials, and manufacturing experience — and that each limit should be scientifically justified rather than set arbitrarily or solely by convention.
For assay limits, the justification must address both the release limit and the shelf-life limit. A release limit of 98.0–102.0% of label claim is defensible when the batch data shows a process capable of delivering that range consistently — a Cpk calculation from the PPQ batch dataset confirms that the process mean is approximately centered between the limits and that the standard deviation places the process capability well above 1.33. Where the PPQ batch data shows that the process reliably delivers results between 99.2% and 100.8%, setting the release limit at 98.0–102.0% introduces a specification window that is wider than what the process requires and wider than what a stability-based argument would support. A reviewer seeing a 4% specification window against a batch dataset with a total range of 1.6% will ask for justification of the wider limit — and the absence of a clear answer will generate a deficiency letter requesting a tighter release limit or a documented rationale for the gap between process capability and specification width.
The safety basis for impurity limits is the second pillar of P.5.6 justification. For each degradation product with a limit set in the specification, the justification must either establish that the limit is below the ICH Q3B(R2) qualification threshold — in which case the threshold itself provides the safety basis — or provide a qualification argument for any limit set above the threshold. The clinical exposure data from the pivotal studies is directly relevant here: if the highest observed degradant level in the batches used in clinical studies was 0.12%, and patients in those studies showed an acceptable safety profile, that clinical experience provides a qualification basis for a limit set at or near 0.15% (assuming that level is consistent with ICH Q3B(R2) thresholds and the product’s dose regimen). The argument must be explicit: the observed batch level, the clinical exposure level at that batch result, the ICH Q3B(R2) threshold applicable to this product’s dose regimen, and the conclusion that the proposed limit is consistent with the demonstrated safety profile. An ICH Q1A(R2)-derived stability projection that shows the degradant will not exceed the proposed limit within the proposed shelf life is the final element — the limit that is scientifically justified at release must remain scientifically justified at the end of shelf life.
For tight limits on attributes such as content uniformity or dissolution, the justification moves in the opposite direction — here the argument is that the specification is set tighter than a conventional criterion because the process is capable of meeting it and because the clinical data support its necessity. If the pivotal clinical formulation was manufactured to a content uniformity limit of 90.0–110.0% of label claim but the commercial process consistently delivers results within 95.0–105.0%, tightening the commercial specification to 92.5–107.5% is defensible as a process-based tightening that provides greater patient assurance. The Cpk calculation from the commercial batch data is the foundation of this argument: a Cpk of 1.8 against the tighter limit demonstrates that the process can meet the stricter criterion with a margin that makes OOS results extremely unlikely, while the clinical bridge confirms that the material produced within the tighter limit is representative of the clinical experience.
XGene Batch Data-to-Specification Alignment Review: Three Checks Before Submission
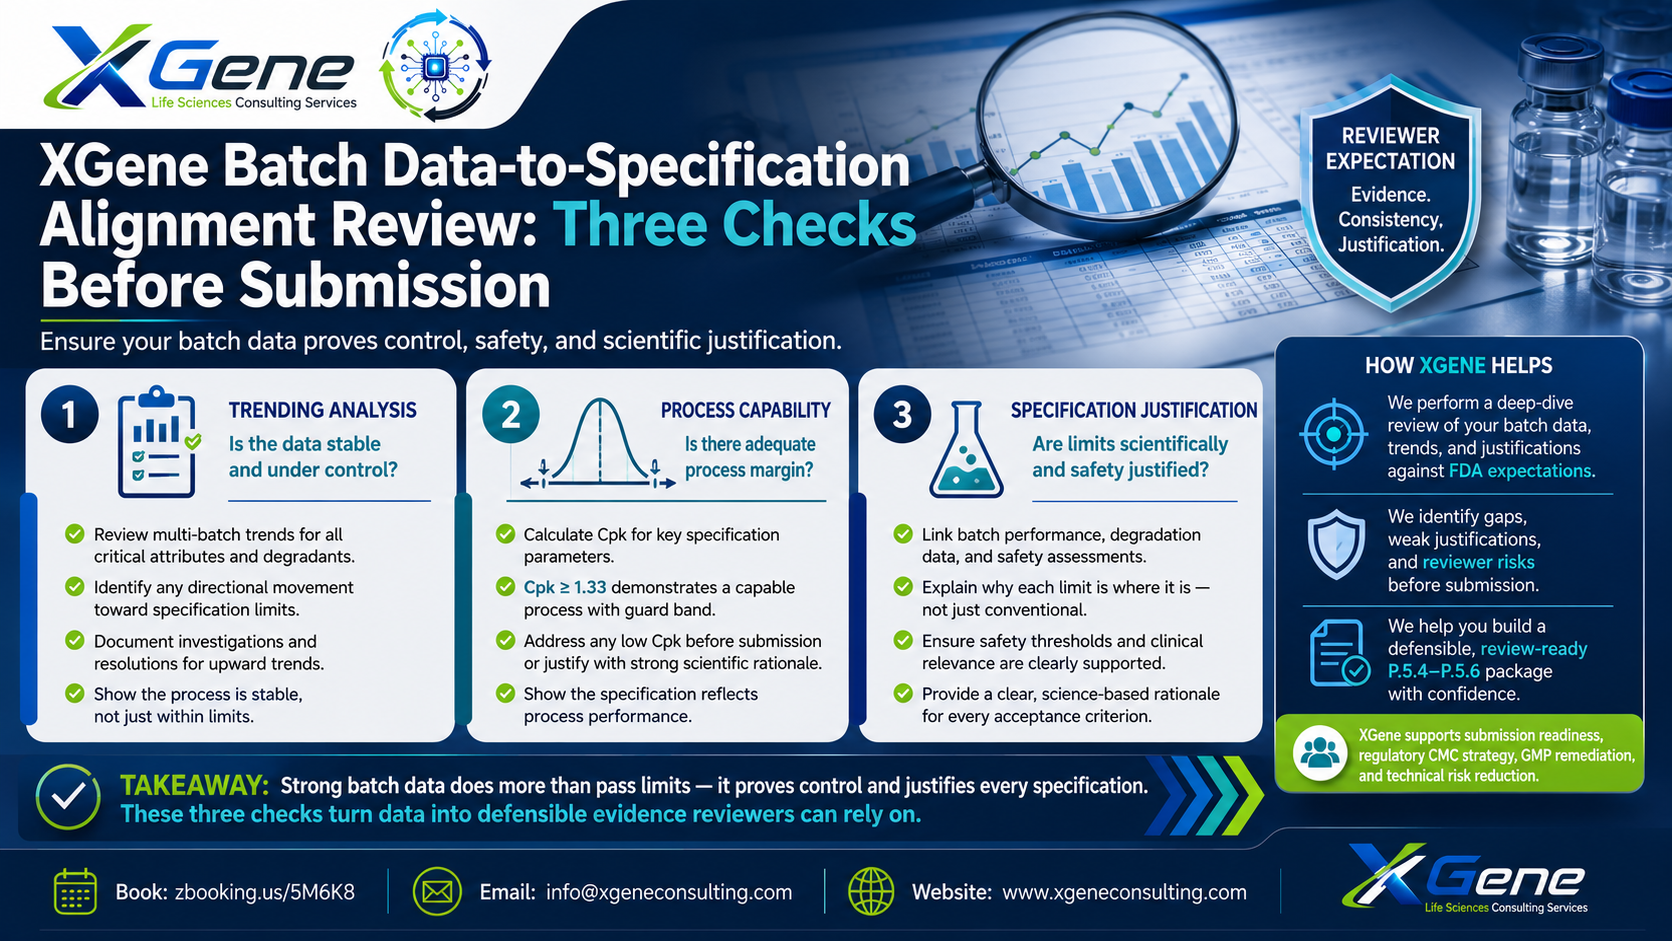
The XGene Batch Data-to-Specification Alignment Review is a structured pre-submission audit of the P.5.4 through P.5.6 package, organized around three checks that address the most common categories of P.5 deficiency in this section range.
Check 1 — Specification Width vs. Process Capability: For each quantitative attribute in the specification — assay, individual degradation products, water content, uniformity — calculate the Cpk index from the complete batch dataset included in P.5.4, encompassing both clinical and PPQ batches. Flag any attribute with Cpk below 1.33: this indicates the process is producing results closer to the specification limit than the conventional capability threshold permits, and either the process requires improvement or the specification requires widening with documented justification. Flag any attribute with Cpk above 3.0: this indicates the specification window is substantially wider than the process requires, raising the risk that a clinically significant quality change would pass the specification undetected. Each flagged attribute requires either a specification adjustment or a written justification for why the current limit is appropriate despite the Cpk signal.
Check 2 — Degradation Product Coverage: Compile all degradation product peaks observed at or above the ICH Q3B(R2) reporting threshold — 0.10% for products with a maximum daily dose (TDI) of 1 g or less, 0.05% for products with TDI greater than 1 g — across the batch analysis dataset (P.5.4), the forced degradation study data (P.5.3 supporting data), and the stability study results (P.8). For each peak at or above the identification threshold — 0.10% or 1.0 mg/day TDI (whichever is lower) for TDI ≤ 1 g, or 0.05% for TDI > 1 g — confirm structural characterization is documented. For each characterized peak, confirm an ICH M7(R1) assessment has been performed if the structure contains an alerting feature. Map every confirmed degradant against the specification in P.5.1 and verify that a limit exists for each identified compound. Any peak present in the batch data or stability data that is at or above the reporting threshold but absent from the P.5.1 specification is a gap that will generate a deficiency letter.
Check 3 — Trending Analysis: For each critical attribute in the batch analysis dataset, plot the results in chronological order of manufacturing date. Identify any attribute showing a statistically directional trend toward a specification limit — defined as three or more consecutive results moving in the same direction — and calculate the linear regression projection to estimate the batch number at which the attribute would be expected to exceed the specification limit at the current trend rate. Any attribute with a projected OOS event within the proposed shelf life or within a commercially reasonable number of future batches requires process investigation prior to submission. A trending analysis that projects specification breach within the product’s commercial life is not a P.5.4 presentation problem — it is a process control problem that must be resolved in manufacturing, not explained in the CTD.
The output of the XGene Batch Data-to-Specification Alignment Review is a pre-submission specification evidence map: each acceptance criterion mapped to its Cpk index and its P.5.6 justification category, each degradation product mapped to its identification and qualification status, and each trending attribute mapped to its investigation outcome. This package is designed to close the evidentiary loop in P.5.4 through P.5.6 before the submission is filed, not after the deficiency letter arrives.
The specification justification section exists because a limit without a rationale is not a regulatory commitment — it is a number. FDA reviewers understand that the process of setting acceptance criteria involves choices, and they expect those choices to be explained in terms of the data that informed them. Batch analysis results that cluster near a limit without explanation, degradation products observed above an ICH Q3B(R2) threshold without structural characterization, and limits asserted in P.5.1 without the supporting argument appearing in P.5.6 are the recurring patterns that extend review timelines and consume resources that should have been directed toward the next development program. The evidence loop that P.5.4 through P.5.6 is designed to close must be closed deliberately, with data, before the submission is filed.