
OOS Root Cause Analysis — Moving Beyond ‘Analyst Error’
"Analyst error" is not a root cause — it is a conclusion in search of evidence, and FDA’s May 2022 Level 2 revised OOS guidance is explicit that attributing an…
On this pageArticle overview
“Analyst error” is not a root cause — it is a conclusion in search of evidence, and FDA’s May 2022 Level 2 revised OOS guidance is explicit that attributing an out-of-specification result to analyst error without identifying the specific error, the specific step, and the specific evidence is not an acceptable basis for invalidating that result.
I have reviewed hundreds of OOS investigations across the industry, and the pattern is almost universal. A result falls outside specification. The laboratory supervisor reviews the analyst’s notebook. Nothing is visibly wrong. A retest is performed, and the product passes. The investigation is closed with a one-line narrative: “Result attributed to analyst error. Retest results within specification. Product disposition: released.” FDA inspects. Form 483 observation is issued. The company responds that the investigation was thorough. FDA disagrees. The cycle repeats.
The reason this cycle continues is not that quality teams lack scientific talent. It is that most OOS SOPs define “assignable cause” in terms that stop far short of the evidentiary standard FDA actually applies. FDA’s 2006 Guidance for Industry on Investigating Out-of-Specification Test Results makes this standard explicit, and it is considerably more demanding than standard laboratory practice acknowledges.
The FDA Evidentiary Standard for Assignable Cause: Specific Step, Specific Evidence, Quantitative Explanation
Under that guidance, attributing an OOS result to laboratory error requires three discrete demonstrations. First, you must identify the specific procedural step where the error occurred — not “sample preparation” as a phase, but the precise action: “the analyst transferred 1.0 mL of sample solution instead of the required 0.1 mL in step 4 of the extraction procedure.” Second, you must produce specific evidence that confirms the error occurred — not an absence of documented contrary evidence, but affirmative proof: a balance printout showing 1.008 g transferred against a required 0.101 g, an instrument log, a contemporaneous observation by a second analyst, or a retained intermediate sample result that is inconsistent with correct procedure. Third, you must provide a quantitative or mechanistic explanation of why that specific error produced the observed OOS result magnitude — if a tenfold volumetric error in a dilution step would produce a tenfold increase in measured concentration, and your OOS result is twelve percent above the upper specification limit, the two are not causally compatible, and your investigation has not identified the root cause even if it has identified a plausible error.
This three-part structure is not a regulatory formality. It is the logical minimum required to distinguish an assignable cause from a hypothesis. Until all three elements are documented, the investigation has not demonstrated that the OOS result is invalid — it has only asserted that something might have gone wrong. 21 CFR 211.192 requires that the investigation include a determination of the cause of the discrepancy. That determination is not the same as a plausible narrative.
The failure to meet this standard has generated a consistent stream of FDA Warning Letters. Companies have received observations for closing OOS investigations on the basis of retest results alone, without documenting the specific error that necessitated the retest. Others have been cited for attributing multiple OOS results for the same product, same test, and same specification limit to analyst error across successive investigations — without ever identifying a systemic method or training issue that would explain the pattern. FDA’s position in those letters is direct: a pattern of analyst error attributions without systemic investigation is itself evidence that the laboratory’s root cause analysis process is inadequate.
Analytical Methodologies for OOS Root Cause Analysis: 5-Why, Fishbone, and Fault Tree
The analytical methodologies available for OOS root cause analysis — 5-Why analysis, Ishikawa fishbone diagrams, and fault tree analysis — are well established, but their application to laboratory investigations requires deliberate adaptation to the specific failure modes of analytical methods. A fishbone analysis for an HPLC assay OOS is not the same exercise as a fishbone analysis for a manufacturing deviation. The six cause categories — Method, Machine, Material, Measurement, Man, and Environment — must each be pre-populated with the known failure modes specific to that analytical platform: column degradation, mobile phase preparation error, standard weighing error, detector saturation, software integration parameter drift, sample storage temperature excursion, and so on. When the fishbone is built generically, investigators identify generic causes. When it is pre-populated with method-specific failure modes, investigators can trace the result to a specific branch of the diagram and test each branch against available evidence.
The 5-Why methodology is similarly powerful when applied with the FDA evidentiary standard held explicitly in view. The discipline of 5-Why is not in asking five questions — it is in refusing to accept any answer that cannot be supported by evidence before proceeding to the next question. “Why did the analyst transfer the wrong volume?” answered with “because they were unfamiliar with the procedure” cannot be the terminal node of a 5-Why analysis unless you have training records showing the analyst had not been qualified on that specific procedure step, and the investigation connects that qualification gap to the specific action that produced the OOS result. Without that connection, the 5-Why has generated a narrative, not a root cause.
For complex analytical methods — dissolution testing, microbiological methods, particle size analysis — fault tree analysis offers a more structured approach to decomposing the potential error paths. A fault tree begins at the OOS result as the top event and systematically maps the Boolean logic of the conditions that could have produced it: the result is only possible if the sample was improperly prepared OR the method conditions deviated OR the reference standard was compromised OR the instrument was out of calibration. Each branch is then evaluated against the available evidence to determine whether it can be eliminated or whether it requires further investigation. This approach is particularly valuable when the method involves multiple analysts, multiple instruments, or multiple laboratories — because it requires the investigation to explicitly account for all possible paths rather than stopping at the first plausible one.
ICH Q9(R1) provides the risk management framework within which OOS investigations should be situated. The revised guideline’s emphasis on risk-based decision-making and the distinction between uncertainty and variability is directly relevant: an OOS investigation that closes without identifying a specific, evidence-supported root cause does not eliminate the risk that the OOS result reflects a real product quality problem — it merely documents that the investigation was unable to identify the cause. Quality risk management requires that this residual uncertainty be acknowledged and addressed in the disposition decision, not dissolved by a passing retest.
The ISPE Good Practice Guide on Investigations, Root Cause Analysis and CAPA provides additional procedural scaffolding that is particularly useful for teams building or revising their OOS SOPs. The ISPE framework’s distinction between contributing causes, root causes, and systemic causes maps directly onto the laboratory investigation context: a balance that was not calibrated on schedule is a contributing cause; the gap in the calibration schedule that allowed out-of-calibration equipment to remain in service is a root cause; the absence of an equipment status verification step in the analytical method SOP is a systemic cause. Effective CAPA addresses the systemic cause. Most OOS investigations address, at best, the contributing cause.
Practical Implications for OOS SOPs and Systemic Investigation Triggers
The practical implication for every laboratory is this: your OOS SOP must define the evidentiary standard for assignable cause attribution explicitly, not by reference to “thorough investigation.” It must specify what documents must be available to support an analyst error attribution before a retest is authorized. And it must define the threshold at which a pattern of OOS results for the same test or product triggers a systemic investigation — because FDA’s experience, and mine, is that recurring OOS results attributed individually to analyst error almost always reflect an underlying method, training, or system failure that a single-event investigation will never reach.
The XGene OOS Root Cause Analysis Methodology and Trending Program
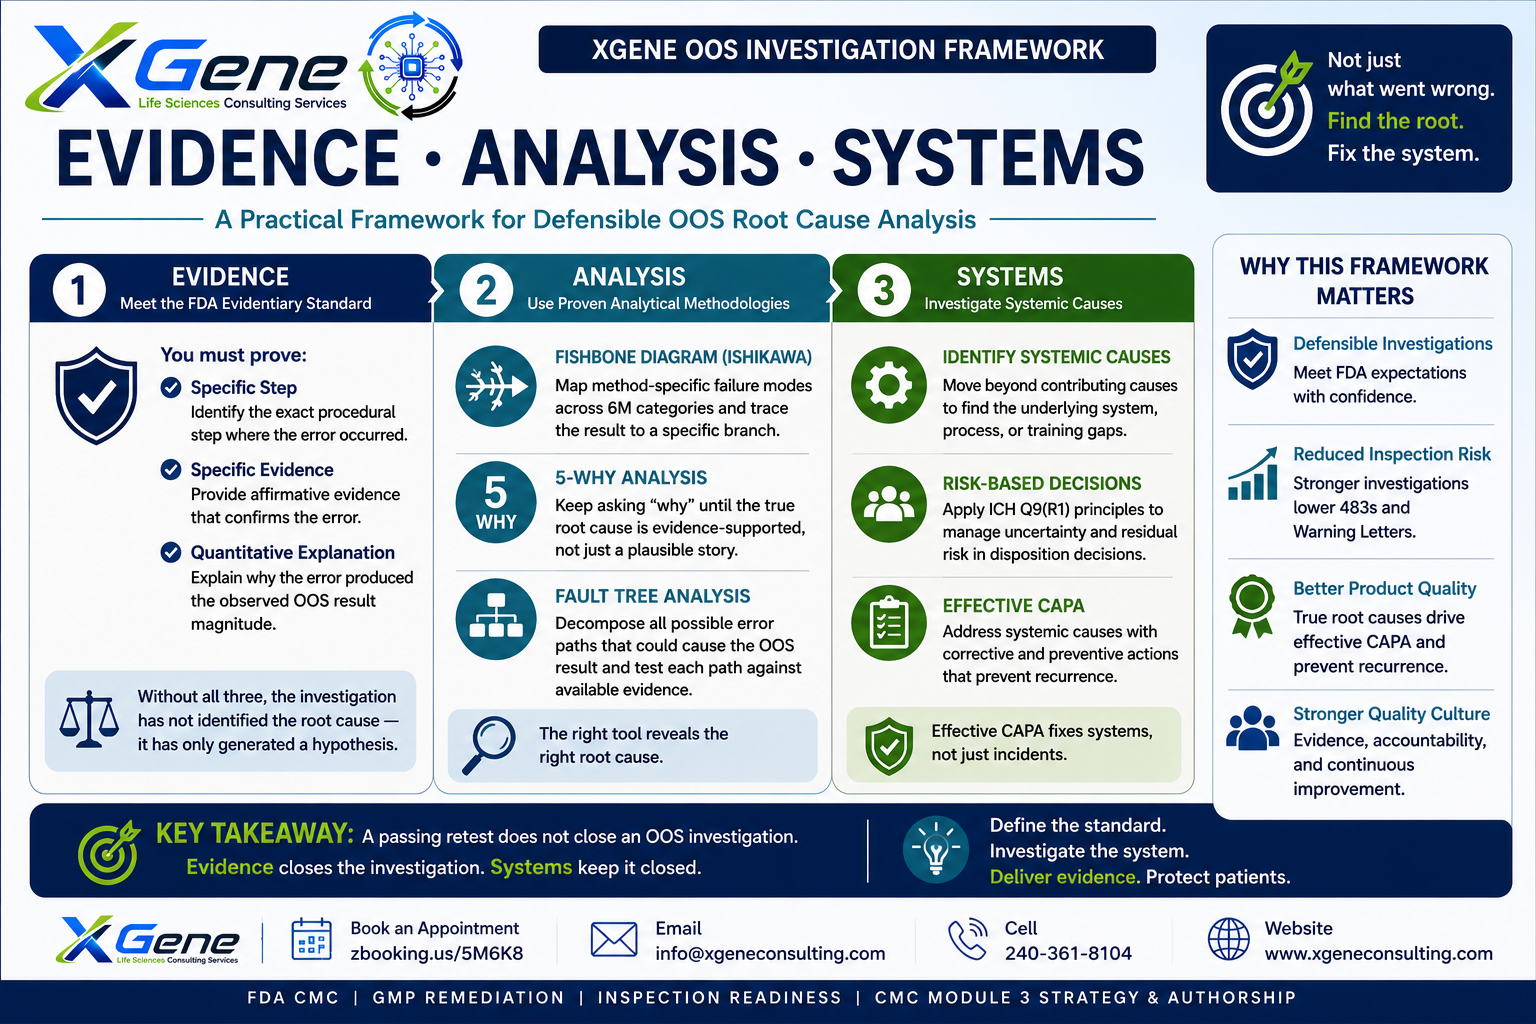
Component 1 — Method-Specific Fishbone Templates Pre-populated Ishikawa diagrams for four method categories: HPLC assay, dissolution, particulate testing, and microbiological methods. Each of the six cause branches (Method, Machine, Material, Measurement, Man, Environment) is pre-loaded with the known failure modes specific to that analytical platform, so investigators work from a structured enumeration of plausible causes rather than a blank template.
Component 2 — 5-Why Guide Anchored to FDA’s Assignable Cause Standard Step-by-step 5-Why protocol that requires each answer to be supported by specific evidence before the next question is posed. The guide includes the three-element evidentiary test for analyst error attribution: specific step identification, specific confirming evidence, and quantitative explanation of OOS result magnitude.
Component 3 — Monthly OOS Trending Dashboard Automated rate tracking by test, product, and analyst on a 30-day rolling basis. Dashboard outputs include: OOS rate trend lines by test method, analyst-level frequency distribution, product-level OOS history, and flagging of any test/product combination with two or more OOS events in a 12-month rolling window.
Component 4 — Systemic Investigation Trigger Protocol Defined criteria for escalating from a single-event investigation to a systemic investigation: same test and product OOS twice in 12 months; same analyst implicated in three or more OOS attributions in 12 months; OOS rate for any test method increasing across two consecutive monthly reviews. Systemic investigation template includes method validation data review, analyst qualification record review, equipment calibration and maintenance history review, and environmental monitoring correlation analysis.